Exercise 4: Cardiovascular Physiology
Figure 4.1 Electrical Conduction Pathway of the Heart.
Exercise 4 Learning Goals
After completing this lab, you should be able to:
- Explain the relationship between electrical and mechanical events of the human heart
- Identify structures associated with electrical conduction of the heart
- Understand and explain the importance of ECG
- Identify ECG tracings and define specific components
- Know arterial blood pressure and how it is measured.
- Describe how the auscultation of the heart is related to valve mechanics
- Be able to take a manual pulse rate and calculate beats per minute.
- Practice operating a sphygmomanometer and accurately measure blood pressure
Pre-Lab Activities for Exercise 4
Background
The heart serves as a pump to drive the flow of blood through the body. It does so by undergoing a cycle of contraction and relaxation called the cardiac cycle. During the initial portion of the cardiac cycle, an electrical signal is generated in “pacemaker cells” that distributes electrical signals through the cardiac muscle cells of the heart. In response to electrical stimulation, the myocardium of the atria (first) and then the ventricles undergo contraction (systole), followed by sequential relaxation (diastole) of the chamber sets a fraction of a second later. This cycle of compressing the blood in the ventricles during systole followed by the filling of the ventricles during diastole induces pressure changes in the ventricles that cause one-way valves in the heart to close and may be heard at different intervals of the cardiac cycle. The result of blood being forced into the arteries by the ventricles generates blood pressure, the primary driving force for the flow of blood through the body. In this exercise, we will examine electrical and mechanical events that take place during the cardiac cycle and measure the resultant blood pressure generated through this contractile activity.
Conduction of Cardiac Muscle
Cardiac muscle tissue is found in the walls of the heart chambers and plays a crucial role in making sure blood flows around the body through contraction of the atria and vesicles and ejection of blood into vessels.
Electrical impulses are required for contraction of cardiac muscle cells. There are specialized cardiac muscle cells that transfer electrical impulses through the heart muscular walls. These specialized cells allow for the coordination of muscle contractions within the heart. The coordination of muscle contraction within the heart ensures the blood is always flowing in the right direction.
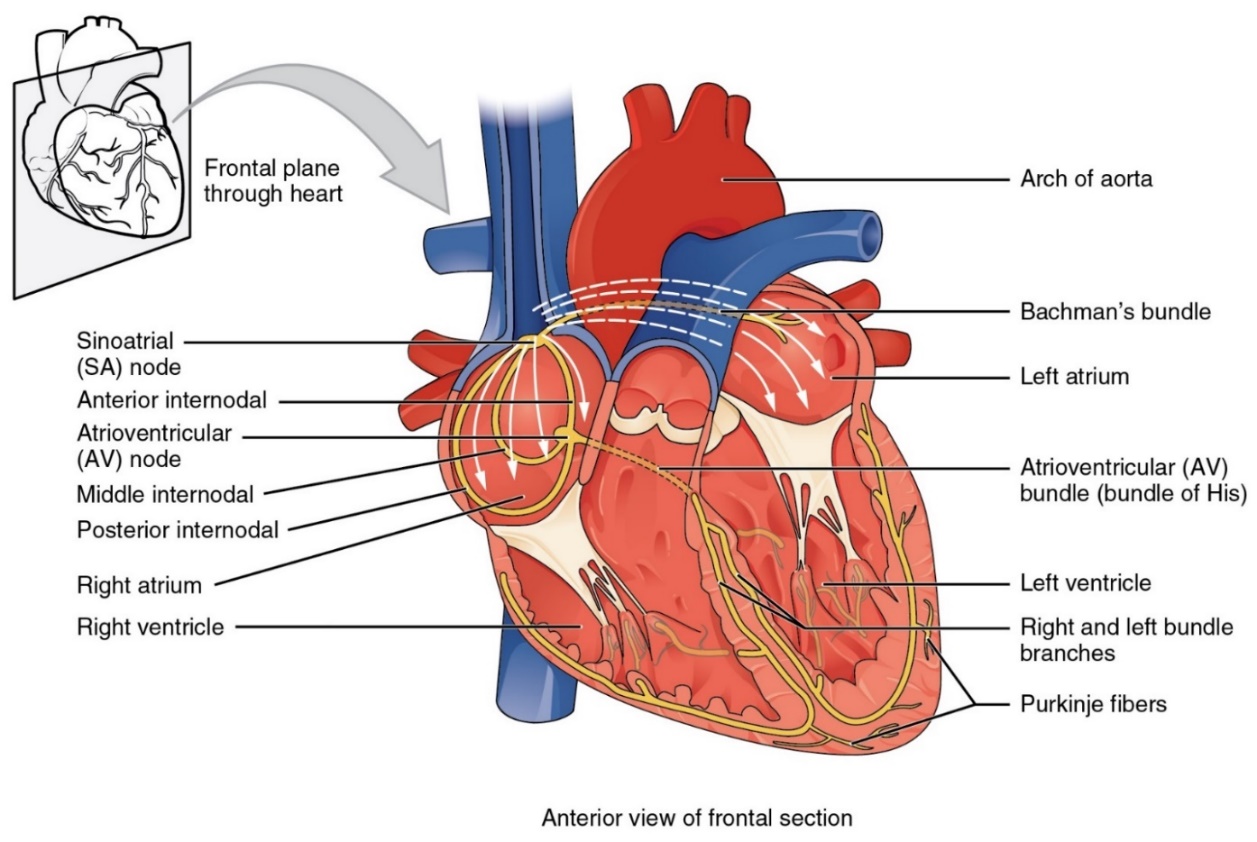 Figure 4.2 Specialized cardiac muscle tissue distributing electrical impulses through the heart.
Electrical conduction begins with cardiac action potentials that propagate through cardiac muscle cells in a specific sequence. Electrical activity begins in the sinoatrial (SA) node, located in the right atrial wall. These cells repeatedly depolarize to threshold potential spontaneously and are the pacemaker cells. These cells trigger spread of an action potential through cells in both atria via gap junctions and eventually reaches the atrioventricular (AV) node in the interatrial septum. The action potential slows as it passes through this point and serves to delay passage of the signal to the ventricles, providing sufficient emptying of blood from atria to ventricles. From the AV node the action potential passes to the atrioventricular (AV or His) bundle and the passes from the atria to the ventricles. The action potential then enters the right and left bundle branches which are in the interventricular septum. Finally, as the action potential reaches the apex of the heart Purkinje fibers conduct the action potential upward to the ventricular myocardium and push the blood in the ventricles toward the semilunar valves.
Electrocardiograms ECG or EKG
Figure 4.3 Electrocardiogram: A normal tracing shows the P wave, QRS complex, and T wave. Also indicated are the PR, QT, QRS intervals and the P-R and S-T segments.
The heart is auto excitatory. Action potentials are formed spontaneously at regular intervals in specialized cells called pacemaker cells. These cells are arranged in a network that enables signals to be conducted throughout the myocardium from the point of origin in the right atria. Four major structures are found within the cardiac conduction pathway. The SA node, located in the right atrial wall near the junction for the superior vena cava, contains pacemaker cells that undergo spontaneous depolarizations at a higher rate than any of the other pacemaker cells in the heart. As a result, the SA node sets the basic pace for heart contraction (the sinus rhythm) and is often called the heart's pacemaker. Action potentials originating in the SA node are conducted rapidly through both atria through tracts of pacemaker cells. Located in the medial wall of the right atrium, near its junction with the right ventricle, AV node. The AV node contains the only pacemaker cells that lead out of the atria, thus electrical signals originating in the SA node and passing through the atria can only be conducted to the ventricles through this structure. The pacemaker cells in the AV node have very low conduction speeds, thus electrical signals pass through this region very slowly. Once the signal passes through the AV node, it is transferred to a structure called the atrioventricular (AV) bundle or Bundle of His, which conducts the signal through the interventricular septum towards the apex of the heart. Soon after entering the interventricular septum the AV bundle bifurcates into two separate branches. The conduction of the electrical signal through the interventricular septum, coupled with the slow conduction speed of the AV node, causes a delay to allow contraction in the atrial myocardium followed by contraction in the ventricular myocardium called the atrioventricular delay. This delay ensures that the atrial systole is complete at the onset of ventricular systole. Once the signal reaches the heart's apex, it is conducted up the lateral walls of the ventricle through branched tracts of pacemaker cells called Purkinje fibers, which distribute the electrical signal to the ventricular myocardium.
Electrical changes occurring during the cardiac cycle can be monitored from the body's surface in an electrocardiogram or ECG recording. A normal ECG recording is associated with a single cardiac cycle and contains three distinctive waveforms. The P wave is generated when the atria depolarize as the action potential wave spreads out from the SA node. The QRS complex (which consists of the Q, R, and S waves) is triggered by the depolarization of the ventricles just before ventricular systole. During the QRS wave the atria are repolarizing, but the small electrical disturbance caused by this is masked by the massive change in charge caused by the ventricles depolarizing. The last waveform, the T wave, is triggered by the repolarization of the ventricles at the end of ventricular systole.
Several important intervals and segments can be measured from an ECG recording. A simple measure of the cardiac cycle's duration can be measured simply as the time that elapses between a particular point in one cardiac to that same point in the next cardiac cycle (e.g., from R wave to R wave). An interval includes a segment and at least one wave, whereas a segment does not include a wave. The PR (or PQ) interval which we measure from the start of the P wave to the peak of the R wave, indicates the duration of time that the atria are depolarized and is roughly equal to the duration of atrial systole. In addition, the PR interval indicates how long it takes electrical signals to travel from the atria to the ventricles (i.e., the AV delay). During the RT (or QT) interval, measured as the duration from the peak of the R wave to the start of the T wave, the ventricles remain in a depolarized state. The duration of this interval is roughly the duration of ventricular systole, thus the amount of time that blood is being forced out of the heart and into the arteries. Finally, the S-T segment (baseline between the end of the S wave and the start of the T wave) is flat because there is no electrical activity occurring during the plateau phase of the ventricles. ECGs are important diagnostic tools for evaluating cardiac abnormalities.
Pre- Lab Activity 4.1: Components of an ECG Tracing
Draw a normal ECG tracing below. Identify and label the various deflections, segments, and intervals.
Include:
- P wave
- QRS complex
- T wave
- PR interval
- QT interval
- S-T segment
In your own words, explain what is occurring in terms of both electrical and mechanical events of the heart for each named item above.
The Cardiac Cycle and Heart Sounds 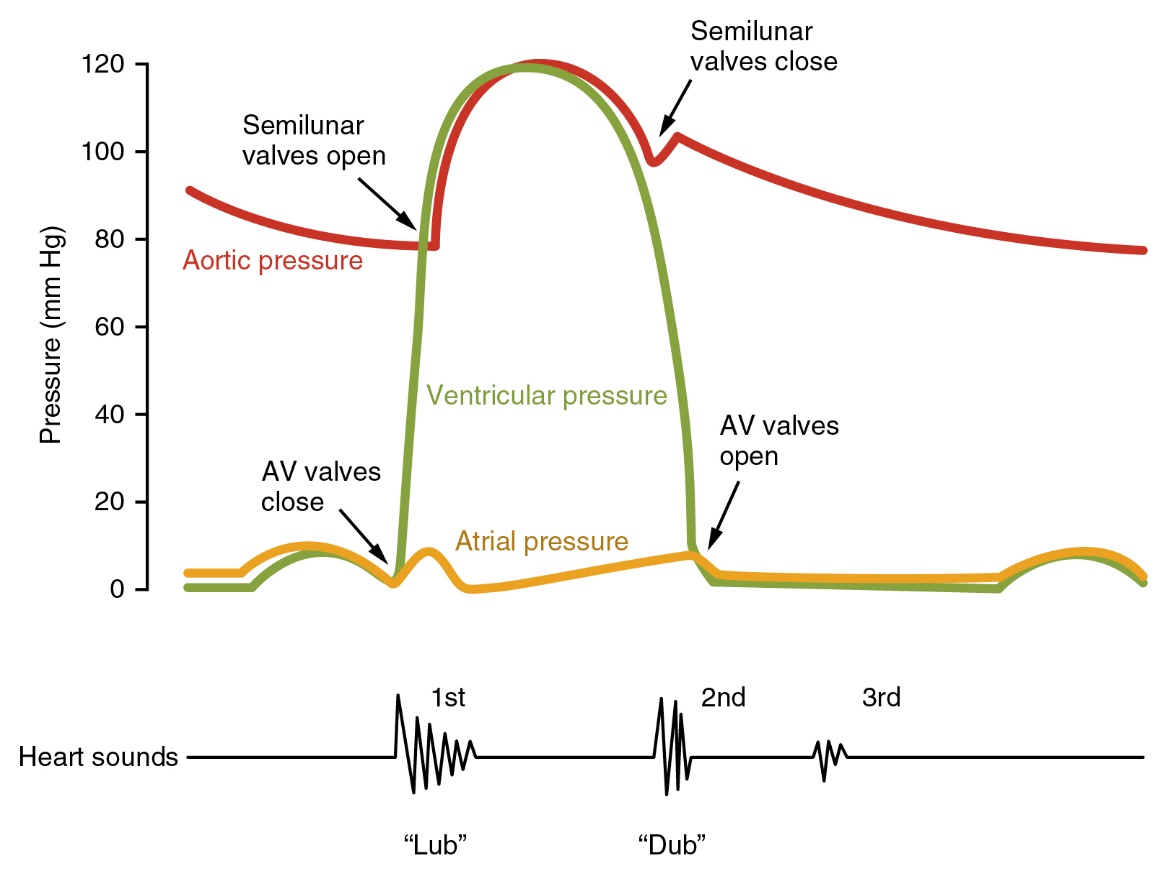
Figure 4.4 Heart Sounds and the Cardiac Cycle In this illustration, the x-axis reflects time with a recording of the heart sounds. The y-axis represents pressure.
The electrical signals recorded on an ECG are caused by intermittent periods where the myocardium of the heart undergoes action potentials. These action potentials trigger the myocardium of the ventricles to contract for a period and then relax. The resultant cycle of contraction and relaxation of the heart is called the cardiac cycle. During the contraction phase of the cardiac cycle (systole), the walls of the ventricles contract on the blood within these chambers. This elevates the pressure of this blood above that of the blood in the arteries, thus forcing blood out of the ventricles and into the arteries. During the relaxation phase (diastole), the blood pressure in the ventricles falls below venous pressure. Thus, blood drawn from the veins fills the ventricles, and the volume of the ventricles expands.
A series of one-way valves prevents backflow of blood from the ventricles into the atria during systole and from the arteries into the ventricles during diastole. The closure of these valves can be heard during the cardiac cycle. The first sound (S1) produced, the “lub” sound, is caused by the closure of the atrioventricular valves at the beginning of ventricular systole when pressure in the ventricles exceeds atrial pressure. The second sound (S2), the “dub” sound, is generated at the beginning of ventricular diastole when ventricular pressure falls below arterial blood pressure and is associated with closure of the semilunar valves.
The Cardiac Cycle and Arterial Blood Pressure 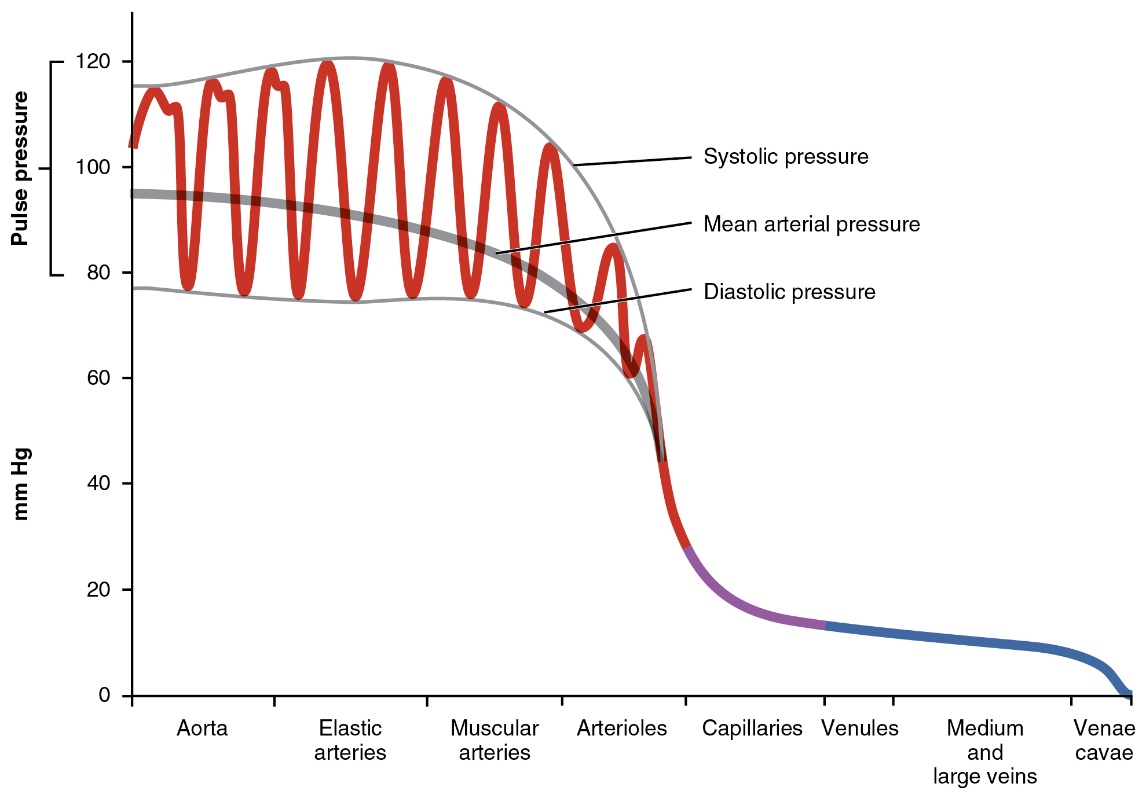
Figure 4.5 Systemic Blood Pressure The graph shows the components of blood pressure throughout blood vessels, including systolic, diastolic, mean arterial, and pulse pressures.
The flow of blood through the cardiovascular system is driven by pressure differences between one segment of a blood vessel circuit and the next. Blood pressure drops sequentially throughout the circuit, and thus the blood at one point will flow to the next where the pressure is lower. The contractions of the heart elevate blood pressure high enough so that it can be propelled through the entire circuit.
Arteries have particularly important roles in ensuring adequate blood flow through the cardiovascular system. Arteries serve as pressure reservoirs—their elastic walls expand during ventricular systole to accommodate the influx of fresh blood under high pressure, and then compress back on the blood during ventricular diastole, maintaining relatively high blood pressure even when ventricular blood pressure has dropped to near 0. This ensures that blood flows constantly through the cardiovascular system throughout the cardiac cycle.
Blood pressure in the arteries oscillates during the cardiac cycle. Systolic blood pressure (i.e., the pressure in the arteries during ventricular systole) is ~120 mmHg, like that of blood in the ventricles during this period. Diastolic blood pressure (pressure in the arteries during ventricular diastole) is somewhat lower at ~80 mmHg, although not nearly as low as the pressure in the ventricles at this time. The difference in pressure between systole and diastole is called the pulse pressure, which is a useful diagnostic measure for cardiovascular health. Another derived measurement is the mean arterial pressure, which is the average blood pressure in the arteries throughout the cardiac cycle. Mean arterial pressure is calculated as follows:
Mean Arterial Pressure (mmHg) = Diastolic blood pressure + 1/3 (Pulse pressure)
Mean arterial pressure is important in identifying chronic hypertension.
Blood pressure can change based on activity levels and on body position. For example, when a person is standing, blood will tend to be drawn into the extremities (particularly the legs) with the force of gravity. Thus, the heart will need to pump harder to recover blood and to deliver blood to the brain against the force of gravity, thus blood pressure will become elevated. In contrast, if a person is reclining, blood tends to pool in the abdomen and thorax, and the effects of gravity become less, thus the heart does not need to pump blood as rigorously to ensure adequate circulation, thus blood pressure will tend to become lower.
Cardiovascular Fitness
Blood flow through the cardiovascular system is adjusted to meet the oxygen demands of the tissues. During elevated levels of activity, cardiac output (the rate that blood is pumped into circulation by the heart) becomes elevated. This is typically due to an increase in both components of cardiac output: heart rate (how frequently the heart beats) and stroke volume (how much blood is ejected from the ventricles with each beat). Although both normally elevate during exercise, the relative contributions of each can differ based on cardiovascular fitness. If an individual exercises regularly, they tend to increase the number of myofibrils in their cardiac muscle cells, and thus the ventricles can contract more forcefully during systole increasing the stroke volume. As a result, heart rate does not need to increase as much during exercise to generate the same degree of cardiac output. This enables individuals who exercise regularly to sustain the same level of exercise for longer periods, to recover more quickly from exercise, and to be able to compensate for changes in circulation (e.g., positional changes) more effectively.
Pre-Lab Activity 4.2: Define Terms
- EKG/ECG-
- Auscultation-
- Pulse rate-
- Sphygmomanometer-
- Mean arterial pressure-
- Blood pressure-
- Heart sounds 1, 2, 3, and 4-
Exercise 4 Activities: Cardio-Physiology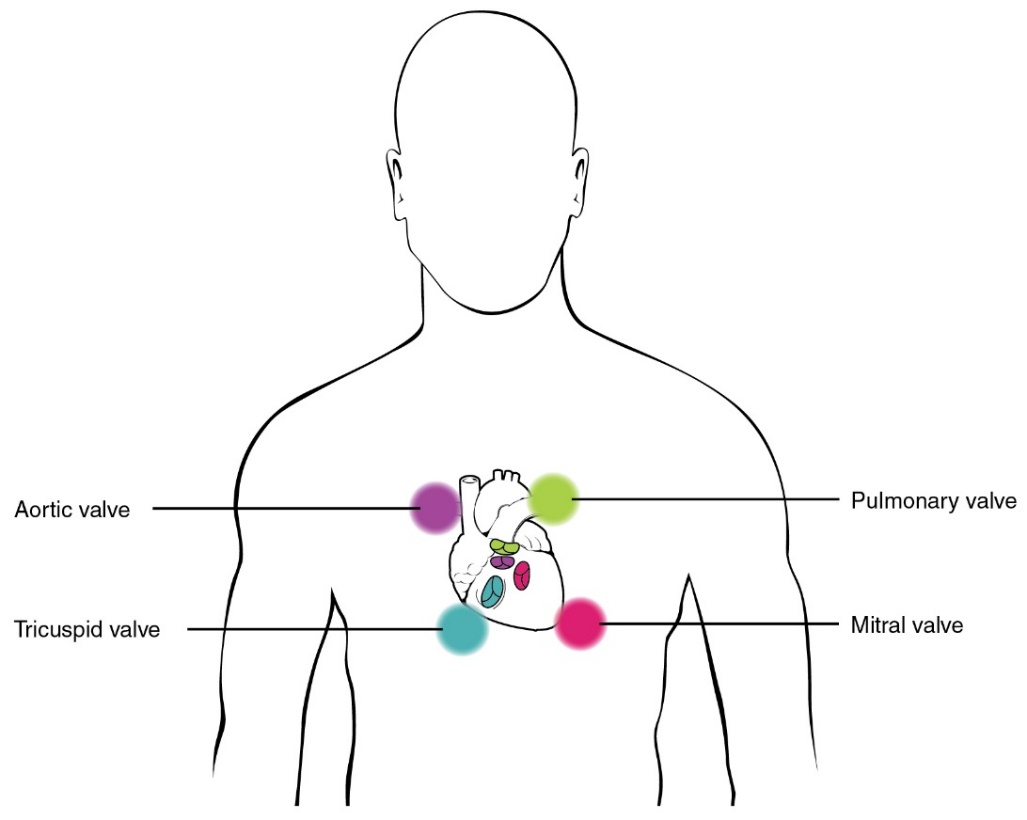
Figure 4.6 Stethoscope Placement for Auscultation: Proper placement of the bell of the stethoscope facilitates auscultation. At each of the four locations on the chest, turbulence of blood through different valves can be heard.
Lab Activity 4.1: Heart Auscultation
Supplies needed: Lab partner, stethoscope, and alcohol wipes (to clean earpieces and the diaphragm of stethoscope).
Place the earpieces of the stethoscope comfortably into both ears and position the bell of the stethoscope at the various positions indicated in the figure to hear the sounds made by flow of blood in conjunction with opening and closing of the heart valves.
Table 4.1 Auscultation: Describe the differences in the sounds heard and the heart valves.
Describe sounds heard | Location of valve | Type of valve | |
Tricuspid valve | |||
Pulmonary valve | |||
Mitral valve | |||
Aortic valve |
Figure 4.7 Blood Pressure Measurement When pressure in a sphygmomanometer cuff is released, Korotkoff sounds may be heard. In this graph, blood pressure tracing is aligned to a measurement of systolic and diastolic pressures.
Lab Activity 4.2: Arterial Blood Pressure
Blood pressure is the force of blood exerted against the walls of the arteries. We measure blood pressure using two components, systolic pressure, the highest-pressure during contraction and diastolic pressure, the lowest pressure when the heart is relaxed. Many factors determine blood pressure including level of stress, age, sex, weight, diet, physical fitness, and medical history. Blood pressure is recorded as systolic/diastolic for example if your systolic pressure is 122 and diastolic is 78, your pressure would be reported as 122/78. Normal blood pressure is a systolic pressure of <120 and a diastolic pressure of <80.
Supplies needed: Lab partner, and semi-automatic blood pressure monitor.
Operating instructions:
- Fitting the Cuff: Place the cuff over the upper left arm so that the tubing is closer to your lower arm. Lay the cuff on the arm so the lower edge lies approximately 2cm (about 0.79 in) above the elbow. Important! The small white ɸ (Artery Mark) on the cuff must lie over the artery which runs down the inner side of the arm. Tighten the cuff by pulling the end and tightening the Velcro flap. There should be minimal free space between the arm and the cuff and clothing should not restrict the arm.
- Lay your arm on the lab bench (palm upward) so the cuff is at the same height as your heart. Remain seated quietly for at least two minutes before you begin measurements.
- Measurement Procedure: After the cuff has been positioned and connected to the monitor, begin the measurement. Press the «ON/OFF» button to turn the device on. You will see a flashing upward triangle, then you will hear 3 short beeps, and a steady “0” will be displayed. Grasp the bulb with your free hand and inflate the cuff to a value between 160−180 mmHg, during which an upward triangle will begin flashing. Stop pumping when the upward triangle stops flashing, the device should then start to deflate. The measurement should proceed automatically, so at this point lay down the bulb and remain in a quiet and relaxed sitting position. If no measurement occurs and all that appears in the display is a flashing upwards pointing arrow, pump the bulb again and inflate to a higher pressure.
- Reading Measurement Results: When measurement is concluded, a long beep tone will sound. The measured systolic and diastolic blood pressure values are then displayed. A downward triangle will flash, indicating the rest of air pressure in the cuff can be released, push the valve near the bulb to release the air manually. The cuff pressure should be quickly released.
- Discontinuing Measurement: If it is necessary to interrupt a blood pressure measurement for any reason, press and hold the quick release valve on the bulb at any time.
Blood Pressure Activity
- With the subject seated and feet supported flat on the floor, apply the cuff of the semi-automatic blood pressure monitor around the upper left arm of the subject so that the hosing for the cuff is positioned over antecubital area.
- Apply the bell of the stethoscope to the skin over the brachial artery in the cubital fossa. Listen and note at what pressure the sounds of Korotkoff (the sounds generated by blood turbulence in a partially occluded artery) begin (systolic pressure) and end (diastolic pressure).
- Repeat the process on both the left and right arms.
Record the values for:
Systolic pressure (SP): _______________mmHg
Diastolic pressure (DP): _______________mmHg
Calculate the pulse pressure (PP) for the subject as follows: Pulse Pressure = Systolic BP – Diastolic BP
_____________ = _____________ - ______________
PP SP DP
Calculate the mean arterial pressure (MAP) for the subject as follows: MAP = Diastolic BP + 1/3 (Pulse Pressure)
_______________ = ______________ + 1/3(________________)
MAP DP PP
Table 4.2 Blood Pressure: Record your arterial blood pressure values.
Arm | Systolic (mmHg) | Diastolic (mmHg) | Pulse Pressure | Mean Arterial Pressure |
| ||||
| ||||
Average Right | ||||
| ||||
| ||||
Average Left |
Lab Activity 4.3: Heart Rate
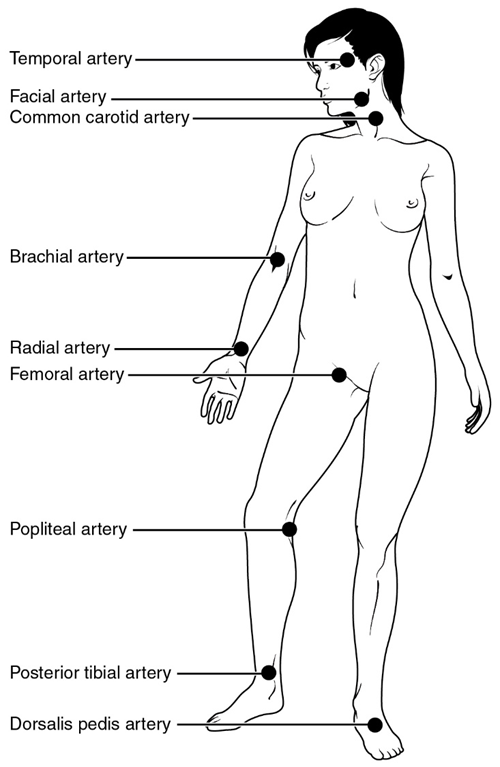 Figure 4.8 Pulse Sites: The pulse is readily measured at the radial artery but can be measured at any of the pulse points shown.
Reclining HR
Supplies needed: Lab partner
1. Have the subject recline using lab chairs or prop their feet up for 5 minutes.
2. Record reclining heart rate by measuring either radial or carotid pulse for 30 seconds and multiplying that value by two. Record this value in the table below.
3. Repeat the process measuring the posterior tibial pulse.
4. Record your pulse values in the table below.
Standing HR
1. The subject should stand up for 5 minutes and their pulse should be immediately measured for 30 seconds then multiplied by two.
2. Repeat the process measuring the posterior tibial pulse.
3. Record your pulse values in the table below.
Table 4.3 Heart Rate and Body Position: Record heart rate values based on pulse point and body position.
Body Position | Pulse Point | Heart Rate (bpm) |
Reclining | Radial or carotid artery | |
Reclining | Tibial artery | |
Standing | Radial or carotid artery | |
Standing | Tibial artery |
Lab Activity 4.4: Electrocardiogram (ECG or EKG)
The pacemaker cells in the heart establish electrical activity in the heart independent of the nervous system. This electrical activity passes through the cardiac conduction system starting with the SA node and is passed to the AV node. There is only one pathway to send the signal from the atria to the ventricles, because of connective tissue insulation, the Bundle of His is the only place where the electrical signal can pass from the atria to the ventricles. The electrical signal is passed from the Bundle of His down the interventricular septum via left and right bundle branches to the apex of the heart and then up the side walls via Purkinje fibers. This electrical activity in the atria first and then the ventricles facilitate the contraction of the atria and then contraction of the ventricles to keep blood moving to the body and lungs. The ECG is an electrical summation of all the action potentials occurring through the electrical conduction pathway in the heart and is detected via sensors on the skin.
Supplies needed: Lab partner, device with ECG set-up (LabQuest®), and 3 new electrode pads.
Device Instructions:
- Use alcohol wipes to clean the inside of your right wrist, right elbow, and left elbow. Wait until the alcohol evaporates and then apply the sticky electrodes to the same locations. The tab on each electrode should point down.
- Connect the alligator clips from the sensor to the tabs on the electrode patches. The black clip (reference) should be connected to the right wrist, the green clip (negative) should be connected to the right elbow, and the red clip (positive) should be connected to the left elbow. If the electrodes are not adhering well to the skin, ask your instructor for a new set.
- Disconnect the LabQuest® ECG measurement device from the AC power (wall outlet) and hold the sensor box in the palm of your hand.
- For the best ECG readings remove all electronic devices from your body and pockets.
- Allow your lab partners to help by holding the LabQuest® device and collecting your ECG data.
- Once you have a normal ECG result, remove the electrode pads, and dispose of them in the regular trash.
Using the LabQuest® Device:
There are physical buttons on the device; however, you can also use the touchscreen functions.
Power Button: If nothing displays on the screen, press, and release the power button located on the top edge of the unit.
Collect Data: Use the arrow button to collect your ECG data read out
Home Button: Launches the Home screen to access other device functions
Escape: Closes applications and menus
- Identify the P wave, QRS complex and T wave on your ECG read out.
- Do you have a normal sinus rhythm?
Activity 4.5: Changes in Heart Rate and Blood Pressure with Exercise
Supplies needed: Healthy lab partner, and semi-automatic blood pressure monitor.
The activities in this exercise evaluate the ability of the cardiovascular system to compensate for changes in body position (which alter the effects of gravity on circulation) and changes in activity (a brief amount of exercise).
This is a low intensity exercise; however, if you have any potentially serious cardiovascular conditions (e.g., chronic severe hypertension, heart disease, etc.) or respiratory issues that could be aggravated by these activities, please only assist in the collection of data.
- Have the subject exercise for 1-2 minutes (or longer if physically fit) continuously (jumping jacks, jogging, burpees, or walk up and down stairs in the lab building). The goal is to get just a little hot and sweaty.
- After 1-2 minutes, when the subject feels a change in their heart rate and breathing, they should immediately stop exercising. At this point, their partner will measure the subject’s blood pressure, as well as their heart rate.
- Continue taking measurements at 2-minute intervals for 10 minutes post-exercise.
- Record results in the table below.
Type of Exercise and Length: | Systolic (mmHg) | Diastolic (mmHg) | Heart Rate (BPM) |
Pre-Exercise | |||
0 minutes post-Exercise | |||
2 minutes post-Exercise | |||
4 minutes Poste-Exercise | |||
6 minutes post-Exercise | |||
8 minutes post-Exercise | |||
10 minutes post-Exercise | |||
Post-Lab Activity 4.1: Questions
- Did you hear all 4 heart sounds? Why or why not?
- What is normal blood pressure as defined by the American Heart Association?
- What is the difference between systolic and diastolic blood pressure?
- What are pulse points? Why are some pulse points preferred over others?
- Was your ECG normal? Why or why not?
- How were your heart rate and blood pressure similar or different from other students at your lab bench?
- Why do you think the differences or similarities occurred in heart rate and blood pressure when at rest?
- What general conclusions can you make about the effects of exercise on heart rate and blood pressure?
- What individual factors can change heart rate and blood pressure during exercise?
- A 14-year-old girl undergoing physical examination prior to being admitted to summer camp was found to have a loud heart murmur at the second intercostal space to the left side of the sternum. Explain the reason for the loud heart murmur associated with this girl’s condition.
Post-Lab Activity 4.2: Matching
Correctly identify valve closings and openings, chamber pressures, and volume line, and the ECG and heart sound lines on the diagram below by matching the diagram labels with the associated terms in the diagram
Figure 4.9 The Cardiac Cycle includes heart sounds, electrical activity, as well as pressure and volume changes in the heart chambers. (Diagram by Gina Profetto)
Letter | Term |
Left ventricular pressure | |
Aortic pressure | |
Aortic valve closes | |
Aortic valve opens | |
Atrial pressure | |
AV valve closes | |
AV valve opens | |
Cardiac cycle | |
Dicrotic notch | |
ECG | |
First heart sound | |
Second heart sound | |
Ventricular diastole | |
Peak of ventricular systole | |
Ventricular volume |